
Visualize your IoT data using Microsoft Azure and Power BI
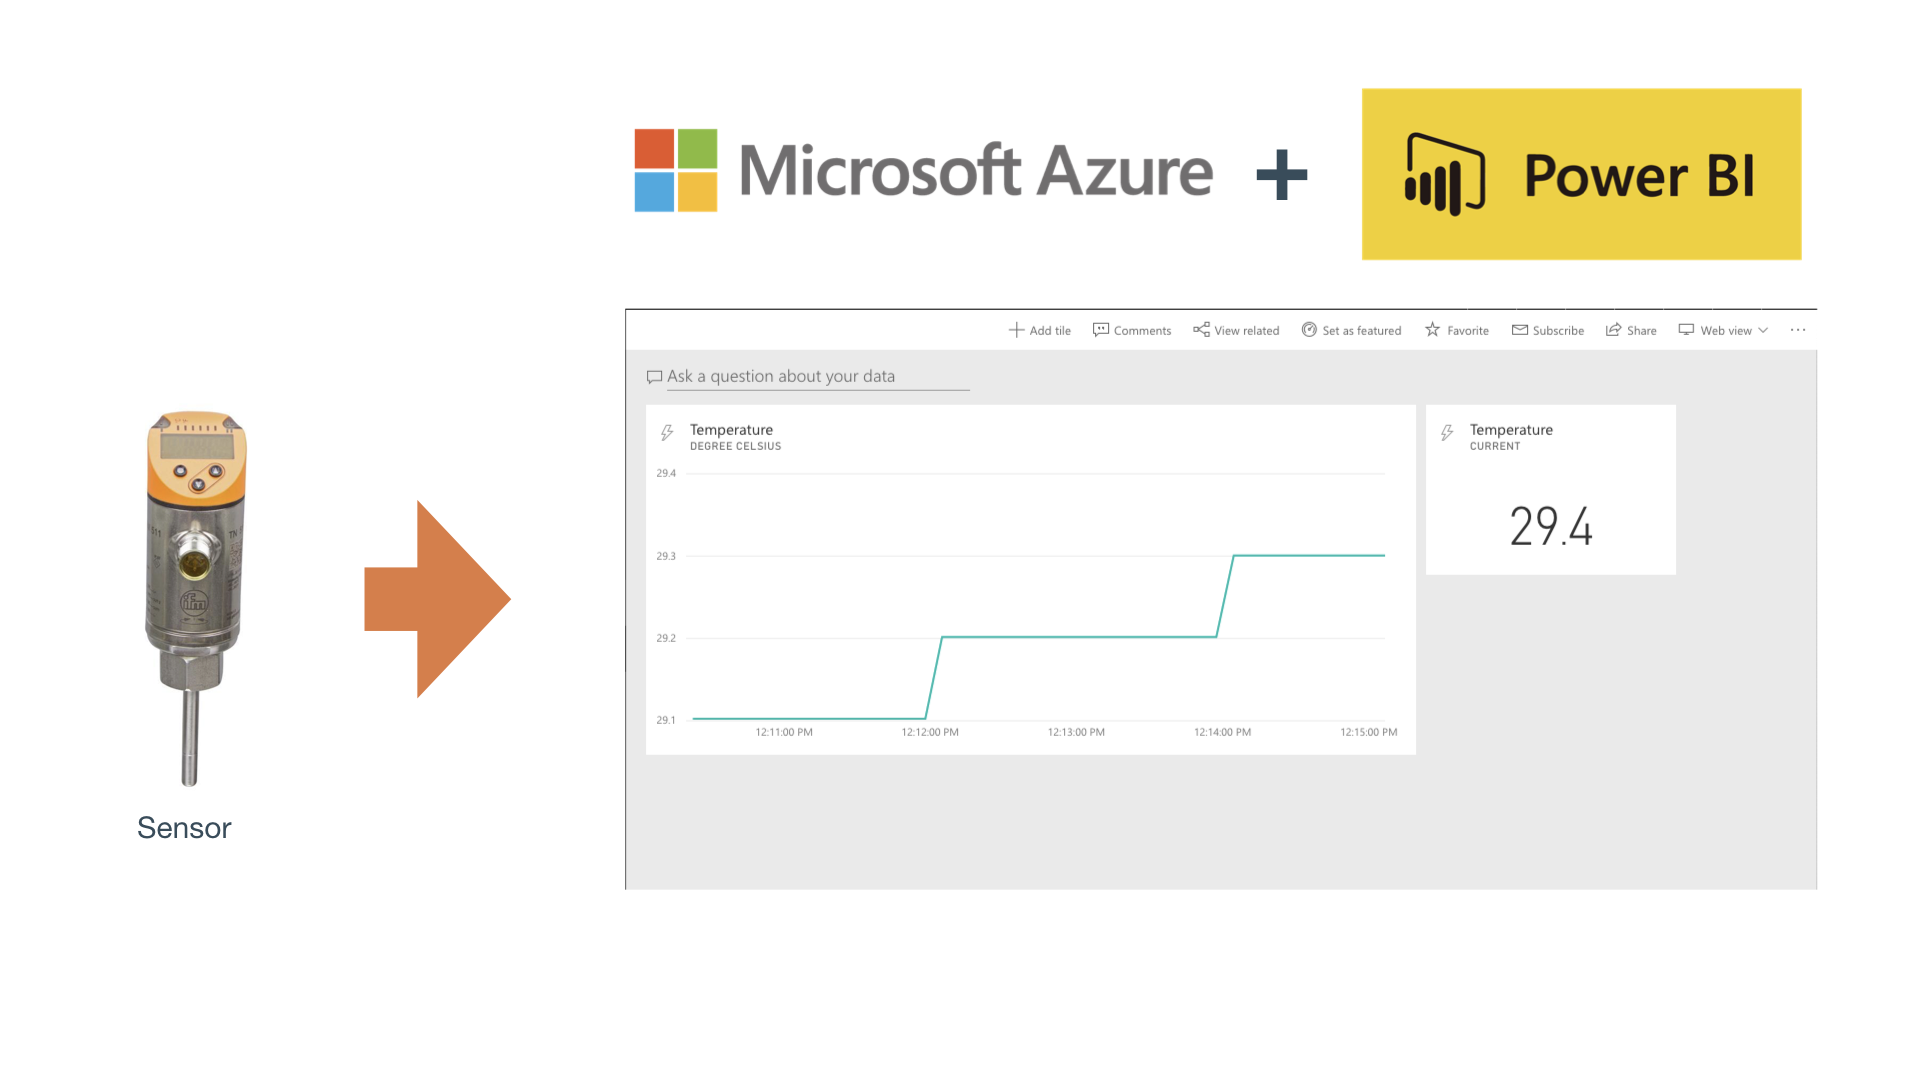
A very common thing to do at one point or another in any IoT or IIoT project is to visualize your data. When you are using the IoT Hub of Microsoft Azure to deliver your data into the cloud, the most logical choice for visualization is Power BI. In this post, I will show you how you can stream data from your Azure IoT Hub into Power BI and how you can build a small dashboard. For the data source we use an industrial IO-Link temperature sensor and the CloudRail.Box. Before I start to go into detail, here is a quick overview of the systems we cover:
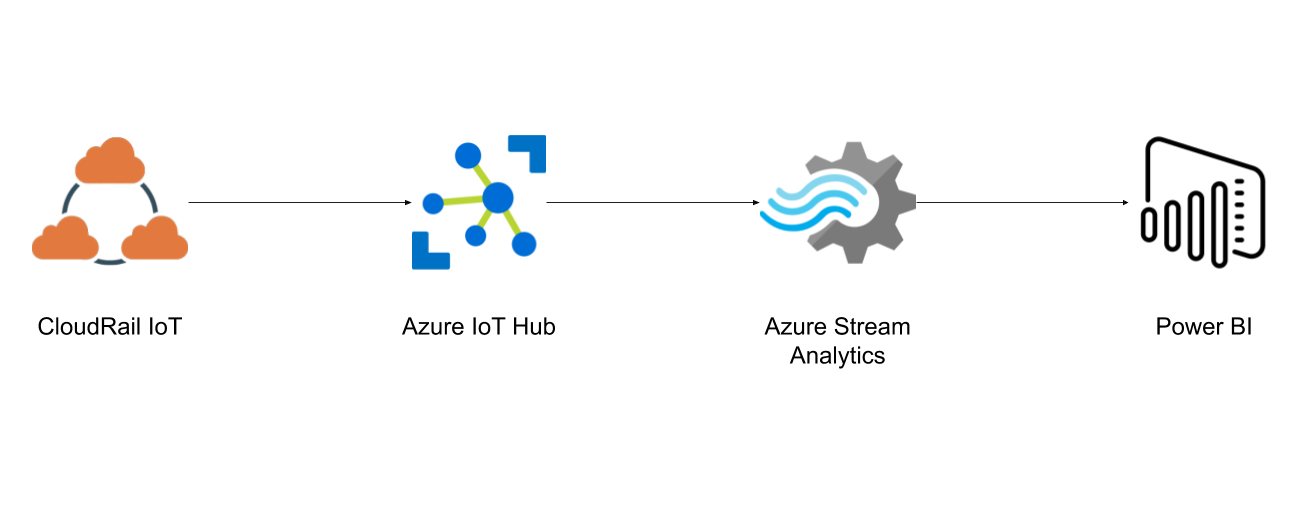
As you can see, there are a couple of systems involved. In order for this post to stay rather short, I will assume that you already have an account on Microsoft Azure and Power BI. For the latter, you can sign up here. Now, let’s get started!
Get data into your Azure account
Before we can do anything else, we need actual data that we can display. If you already have a data source connected to your IoT Hub feel free to skip this step. For this example, we use our CloudRail.Box to connect an industry grade temperature sensor (IO-Link) to Microsoft Azure IoT Hub. In case you have never heard about it I would highly recommend you click the link and watch the video (it’s less than 5 minutes). This should help you understand the next steps.
Setup your Azure IoT Hub
Let’s start by creating your first IoT Hub on Microsoft Azure (if you have done that, skip to next section). Navigate to All services in your Azure portal sidebar. Then search for IoT Hub and select it. At the top, you should see a plus button to add a new Hub. Select the subscription you are using for your account, create a new resource group for your IoT stuff if you want, select the region and give it a name. When you are done, click Review + create at the bottom. You will need to confirm with Create in the next screen. This will now take a couple minutes to set up for Azure.
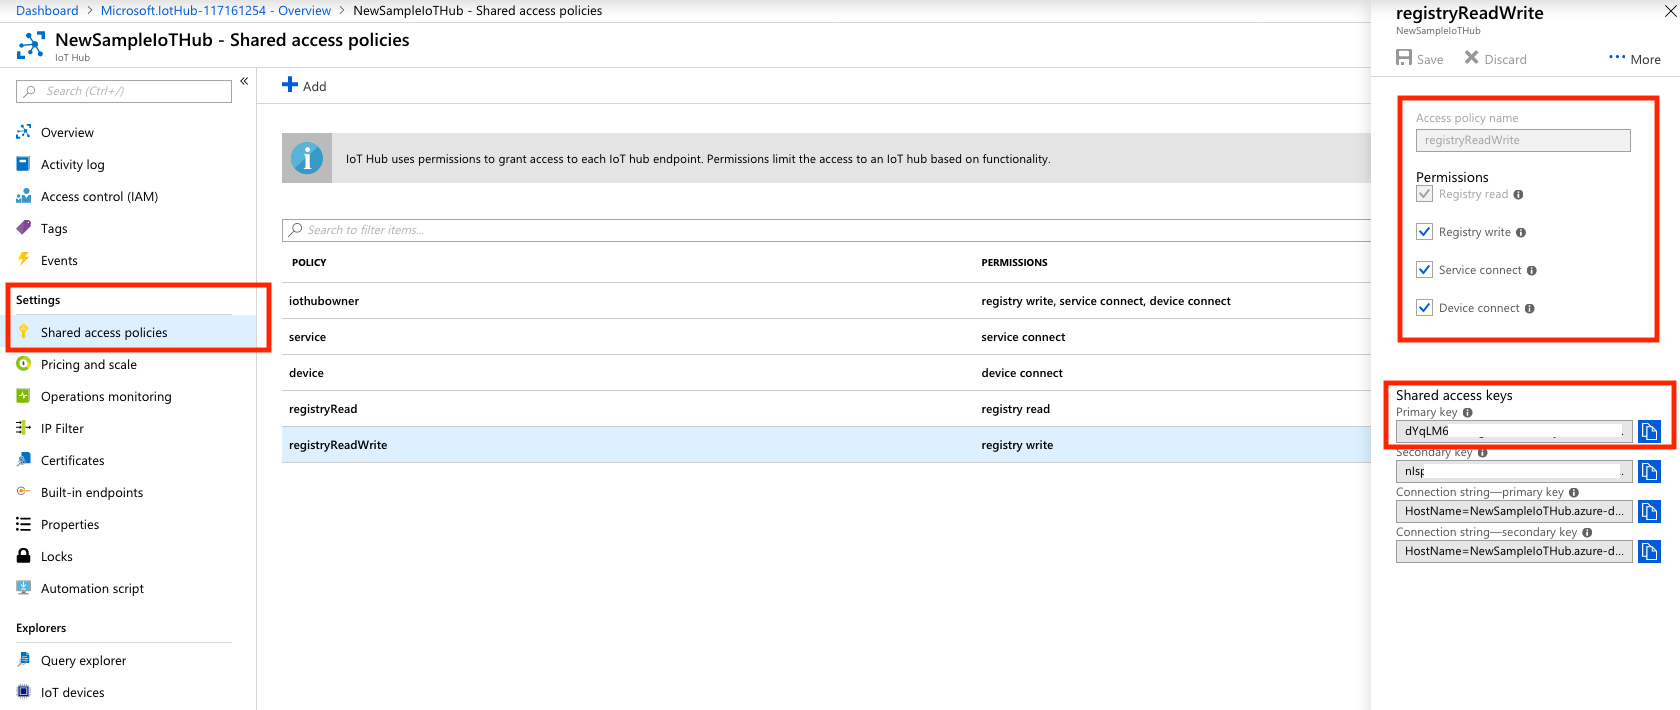
Once this is complete, select the newly created resource. We want to connect the IoT Hub to our CloudRail Device Management next. To make this work, we need two pieces of information. The primary access key as well as the endpoint for your IoT Hub. The picture below shows you where you can find the former. The latter is constructed from the name of your IoT Hub like this: [IoT Hub Name].azure-devices.net.
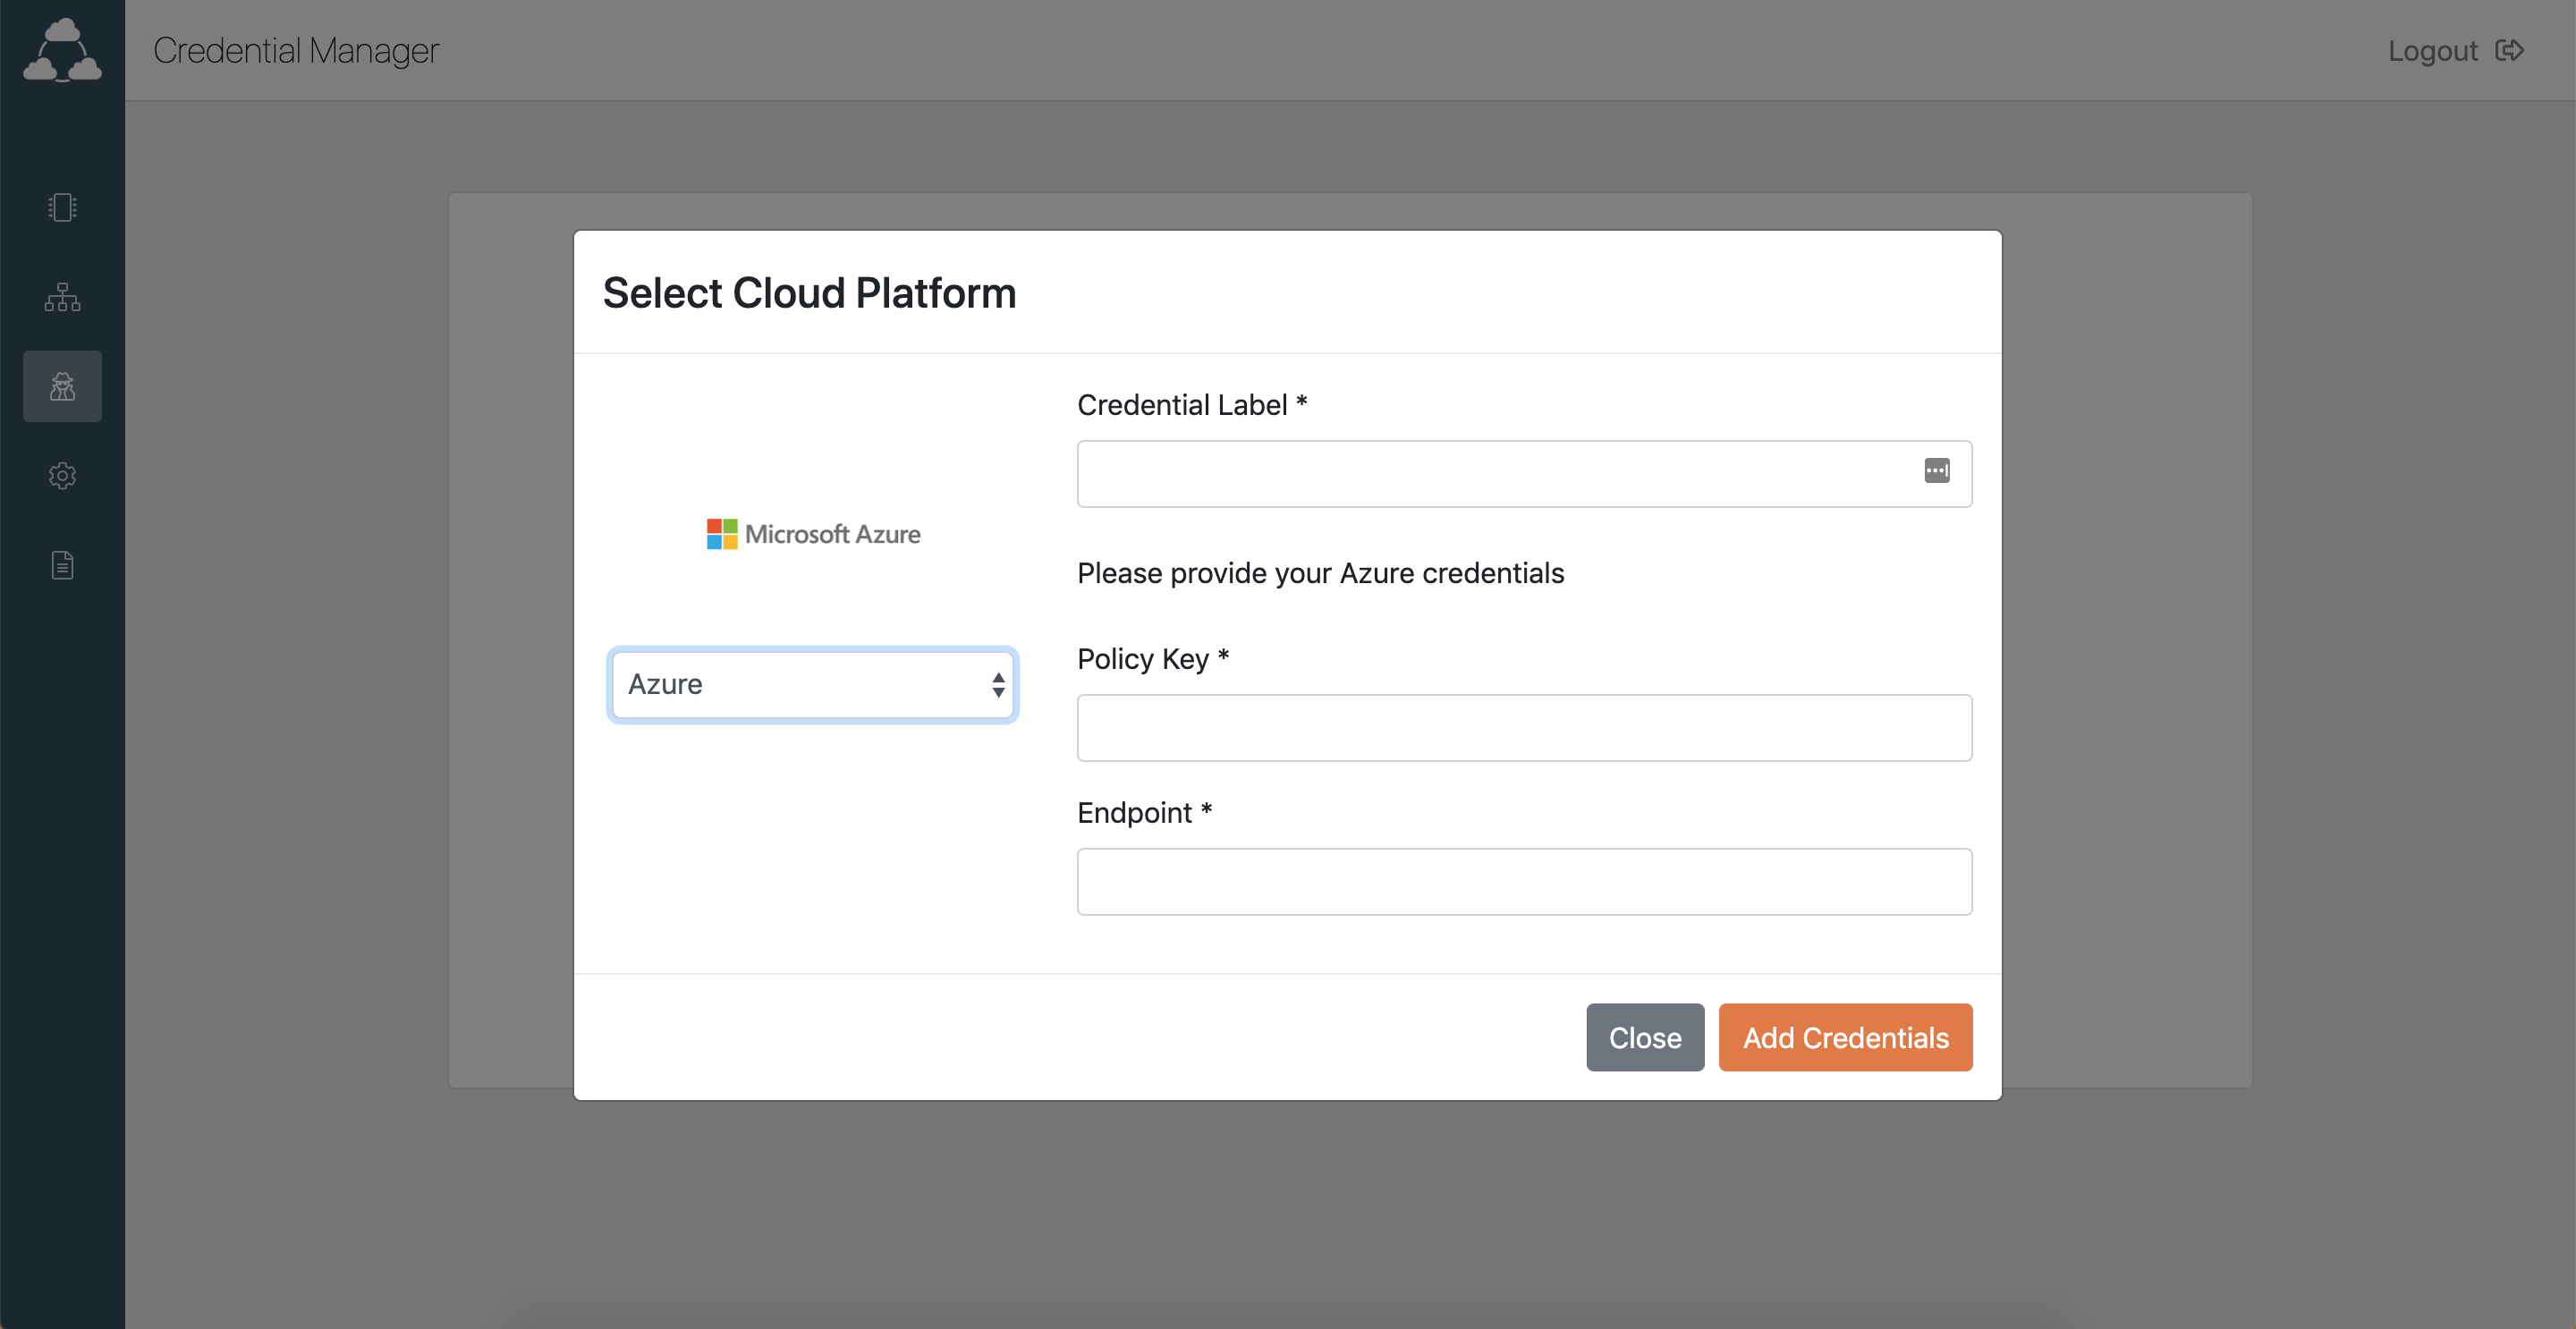
Almost there! Login to your CloudRail account and go to the Credentials Manager. Select Add Credentials and you will get a popup like the one below. Enter your primary access key and the endpoint. Finally, confirm the popup. Your Azure IoT Hub is now linked to your CloudRail account.
Create your first data source
Now that we have set up the Azure IoT Hub we need data from sensors. Luckily, we have made this step very simple for industrial IO-Link sensors. Here is all you need to do (assuming everything is physically connected):
- Login to your CloudRail account, select the Box you want to configure and press New Connection
- Our device management cloud connects to your Box and retrieves all connected sensors. Select the sensor you want to connect to Azure and press Next
- In the next step you can specify the interval in which data is sent to the cloud and then press Next again
- This is where your cloud selection comes in. You will see a list with all the supported IoT cloud platforms. You select Microsoft Azure
- All that is left to do now is to enter a name for the device and press Create
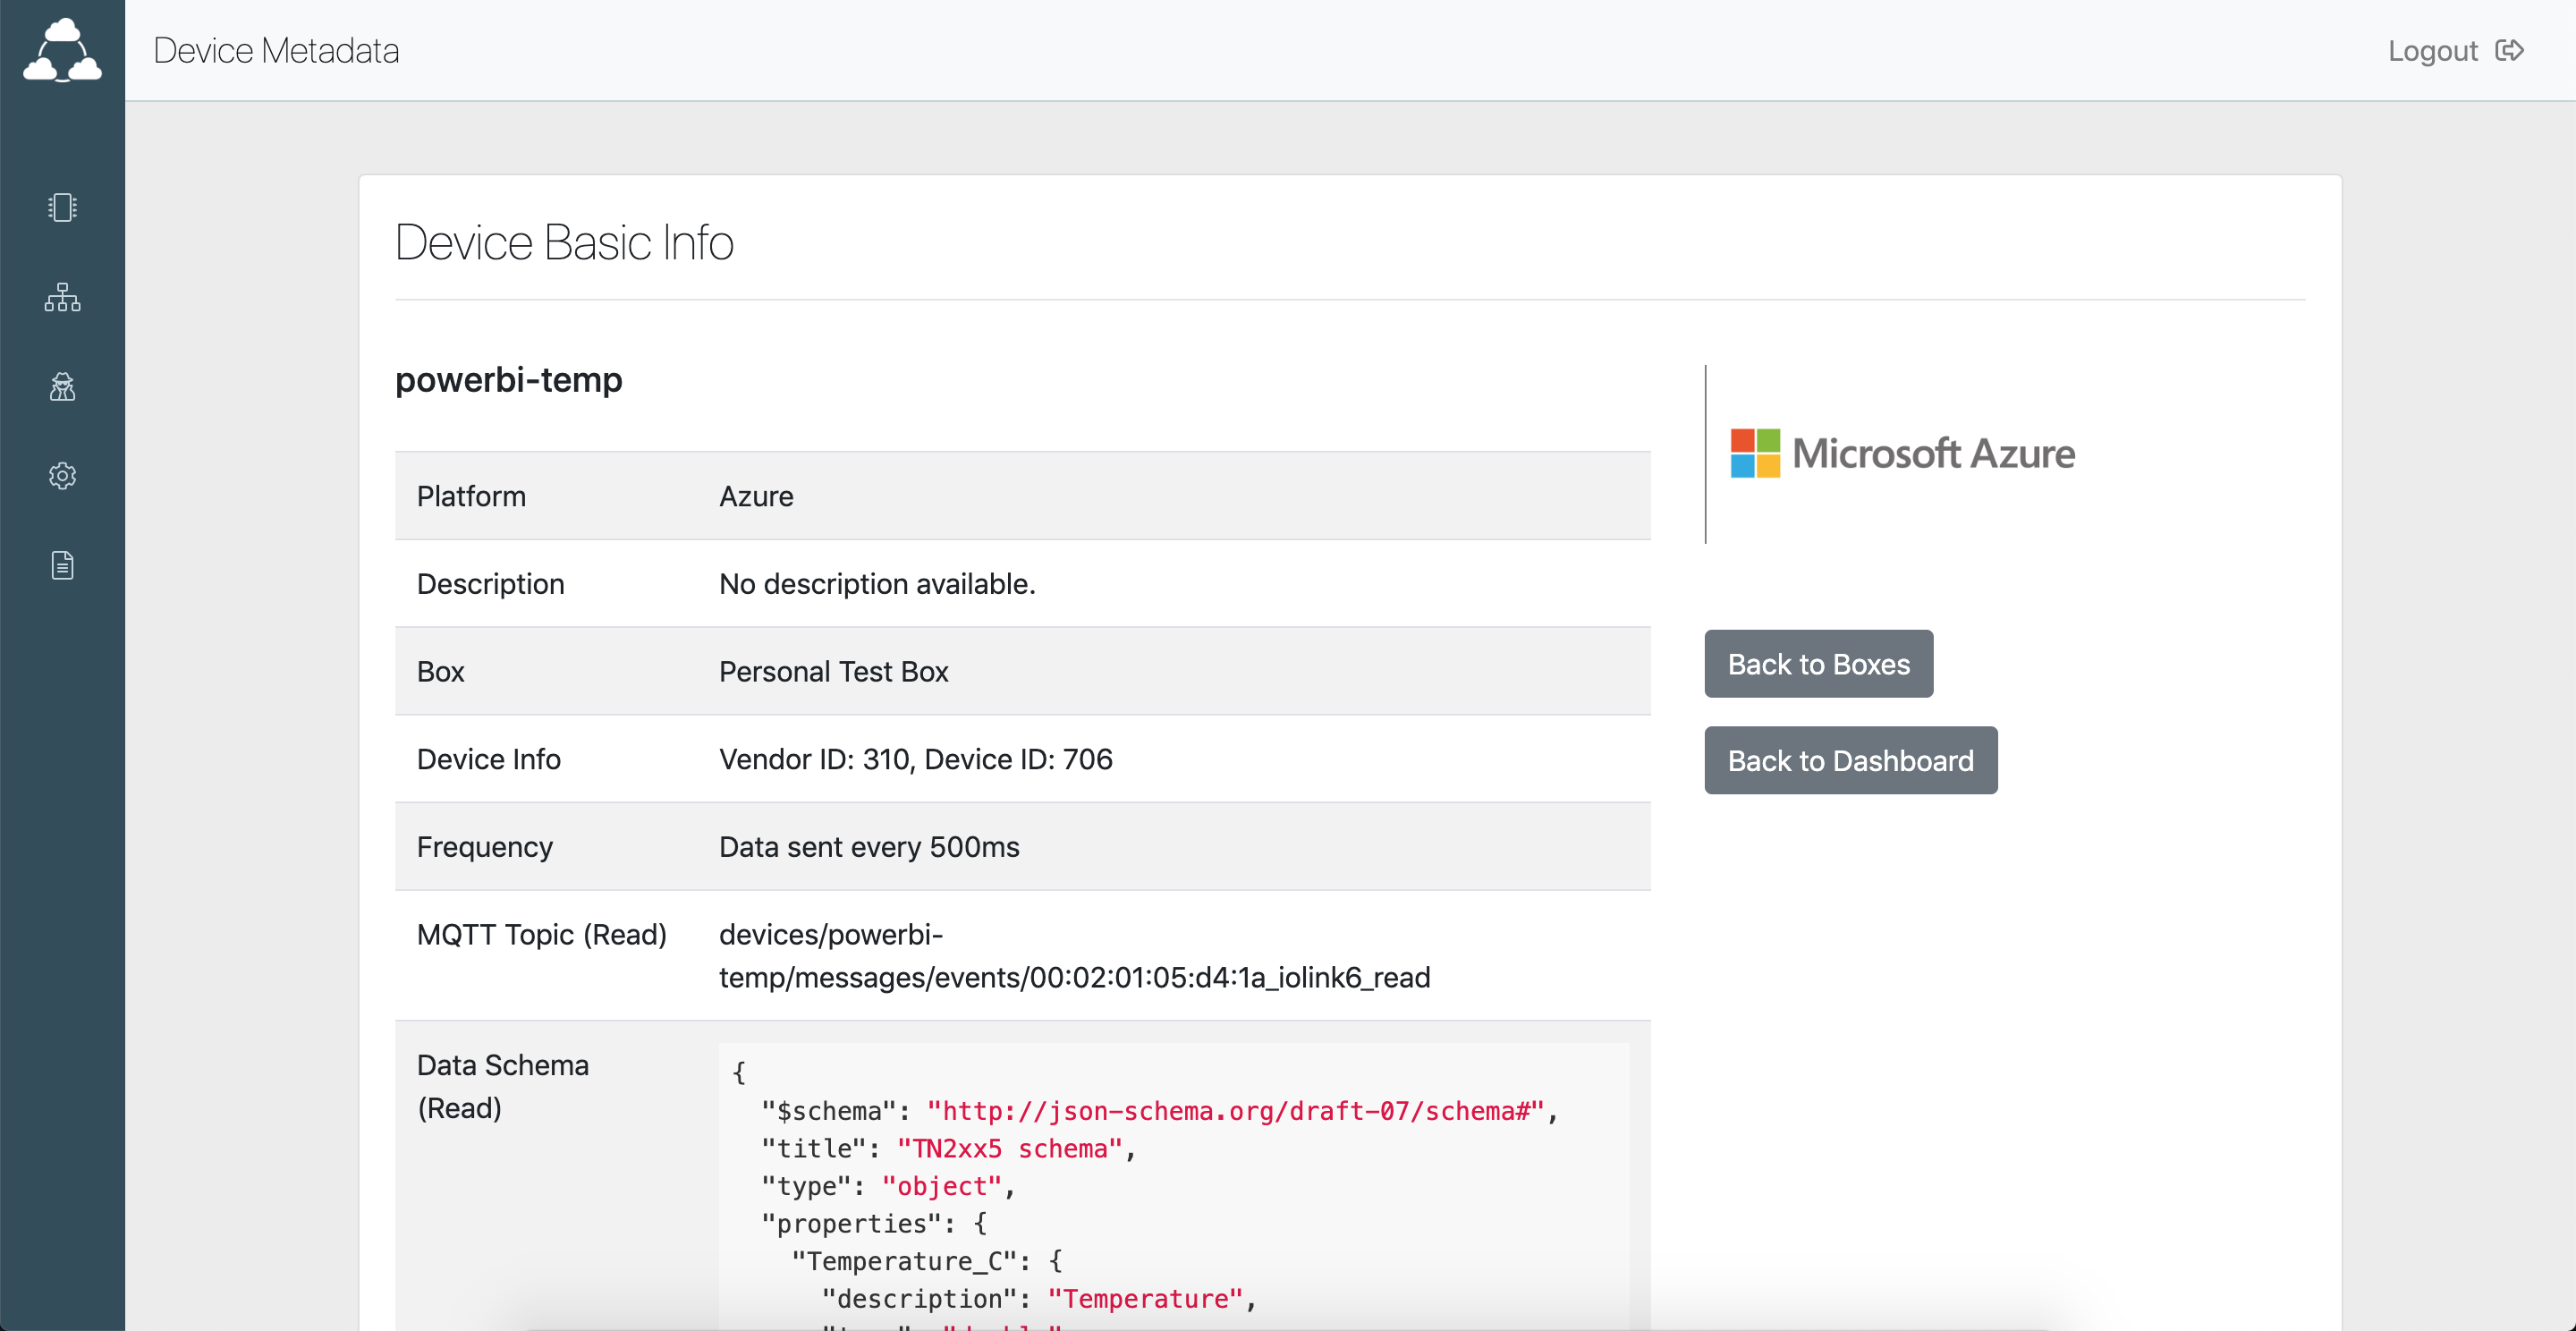
In the background, the management cloud has created the device on your Azure account using the credentials you previously entered. I’ve done the same for a temperature sensor and when everything went well you should see a screen similar to this:
Stream relevant data into Power BI
After all the cumbersome prerequisites we can now focus on moving our data to Power BI. Generally, messages arriving at the IoT Hub are discarded if not actively forwarded to another system within the Azure toolbox. For that purpose, we can use a Stream Analytics Job. Simply put, a Stream Analytics Job is a bridge between a set of inputs and a set of outputs. In addition, we can filter or route messages using a query language.
Before you can create a Stream Analytics Job you have to add a consumer group on your IoT Hub. Select your IoT Hub and then go to Built-in endpoints. Enter a name for your consumer group below $Default and confirm. That’s all.
To create a Stream Analytics Job, go back to All services on the left and search for Stream Analytics. Select it and press the plus button on top to add a new job. Enter a name for the job and select your Azure subscription. The resource group and region need to be the same as the one for your IoT Hub. You can keep the rest of the settings as they are for now. Lastly, hit the Create button. This will again take a while to complete.
Once this is done, we can piece together the different components of the Stream Analytics Job:
Step 1: Add your IoT Hub as an Input
First, you need to add the IoT Hub as an input. This is rather simple. Here are the 4 steps involved:
- Select your Stream Analytics Job and go to Inputs
- Then, select Add stream input in the top bar and then IoT Hub from the dropdown
- Give your input a name, select your IoT Hub from the list and change the consumer group from the default to the one we created earlier
- The remaining settings can stay as they are. I’ll attach a screenshot below for you to reference. When you are done hit Save

Step 2: Link your Power BI account as an Output
After the input is created, we also need to create an output to Power BI. This works quite similar to creating an input. Here is what to do:
- Select your Stream Analytics Job and go to Outputs
- Then, select Add in the top bar and choose Power BI from the dropdown
- In the opening popup, hit the Authorize button first and login with your Power BI account
- Now, enter a name for the output, select the workspace from Power BI (in most cases this will be My workspace), enter a name for the dataset (will be created automatically) and the table within the dataset (also created automatically)
- Last but not least, save the configuration
I will attach my setup so that you can compare it to yours if necessary:

Step 3: Configure the query
Unfortunately, only configuring inputs and outputs is not enough. We still need to tell the Stream Analytics Job which data is supposed to be forwarded from one input to an output. This is done by adding a query. If you only have one data point connected to your IoT Hub you can use a simple query like this one:
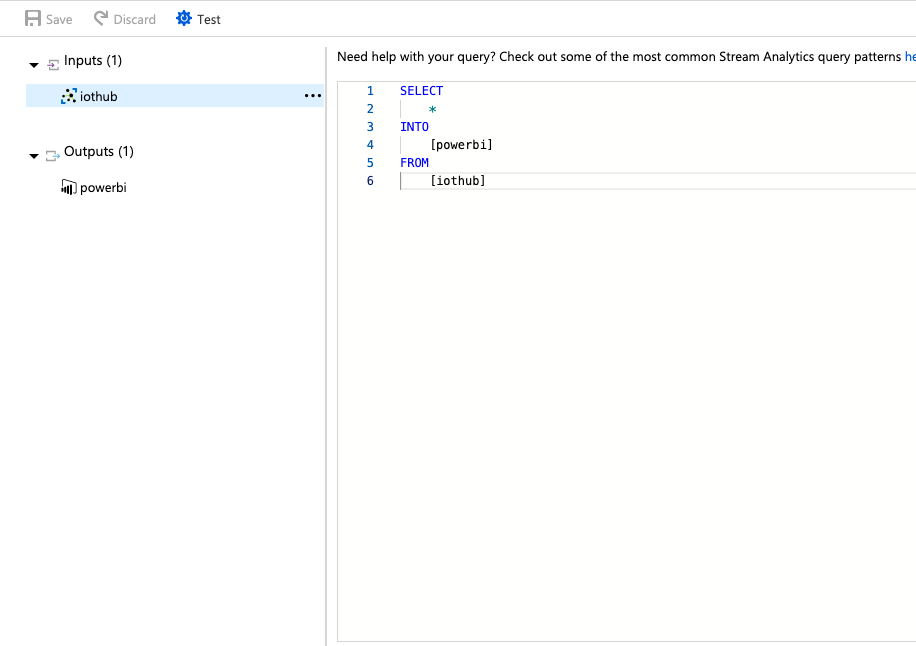
This will basically forward every message from your IoT Hub into the dataset/table you specified for Power BI. However, Power BI requires the same message format for every table entry which means that this configuration might not work in case you have multiple devices connected to the IoT Hub. If that’s the situation for you, you will need to filter the messages and potentially create multiple outputs for multiple tables. Here is a query that filters by a particular property within the message:
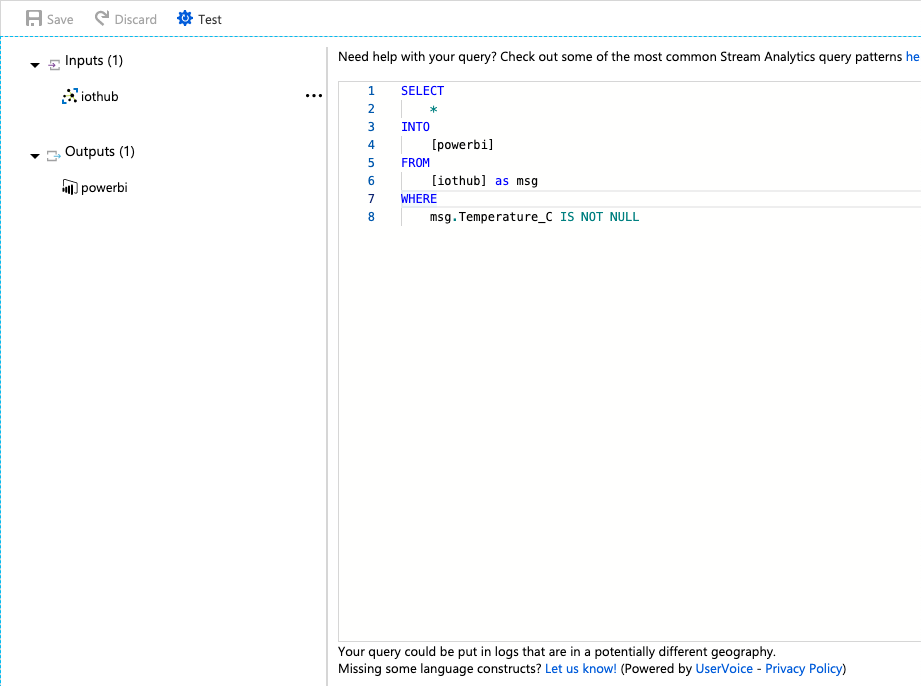
Only messages that have the specified property will be sent to the Power BI dataset. You can create multiple outputs for different datasets and then just insert multiple of those queries below one another.
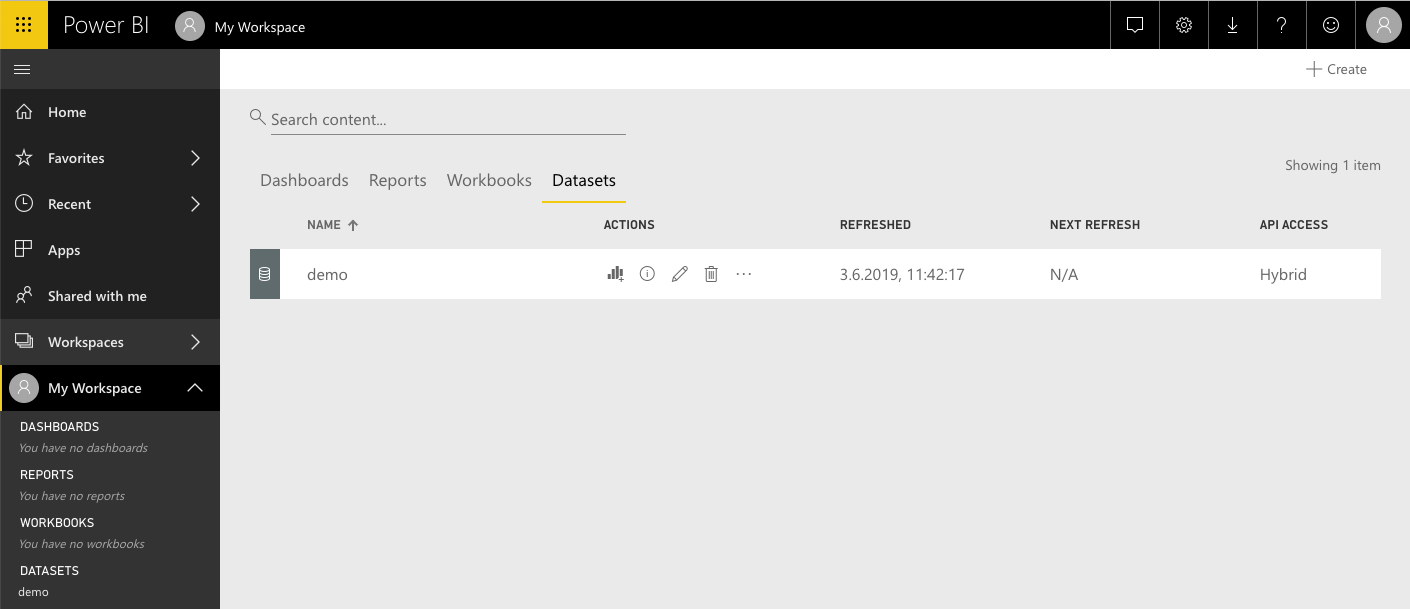
When you have decided on the type of query you need, don’t forget to hit the Save button! Your Stream Analytics Job is now set up correctly and ready to be run. As the last step, go to Overview on the left and hit Start at the top. After a while, your job should be running and if data is entering the IoT Hub it should be forwarded to Power BI now. You can verify this by logging into your Power BI account, selecting your workspace and navigating to Datasets. For me this looks like that:
Build the dashboard on Power BI
I would prefer the setup up until this point to be a bit easier as it actually is but I assume we have to live with it. Luckily, it’s just a one-time effort. We have successfully connected our data source to the Azure IoT Hub and we are forwarding messages to our Power BI dataset. Now, we can finally build our dashboard to visualize the data.
To create your first dashboard, select your workspace from the left side. Then, click the Create button in the top right corner and select Dashboard. Enter the name for your dashboard and confirm the popup. You are now in your dashboard view. From here, you can create multiple tiles to visualize a particular dataset. Here is what I did for my temperature sensor:
- Click the Add tile button on top
- Choose Custom Streaming Data (always choose this option when your data is coming from a Stream Analytics Job)
- In the next screen, select the dataset you want to display
- The following screen allows you to customize the tile you want to use. I selected the Line chart from the dropdown
- As the Axis value I choose EventProcessedUtcTime which should be the time the event got processed by the Stream Analytics Job and should thus be a good time indicator
- For Values, I select my temperature property Temperature_C
- At the bottom, you can specify the time window that should be displayed
- In the last window you can set a title and subtitle for your tile if you want to. The other things are all optional
- When you are satisfied with the result you can click Apply
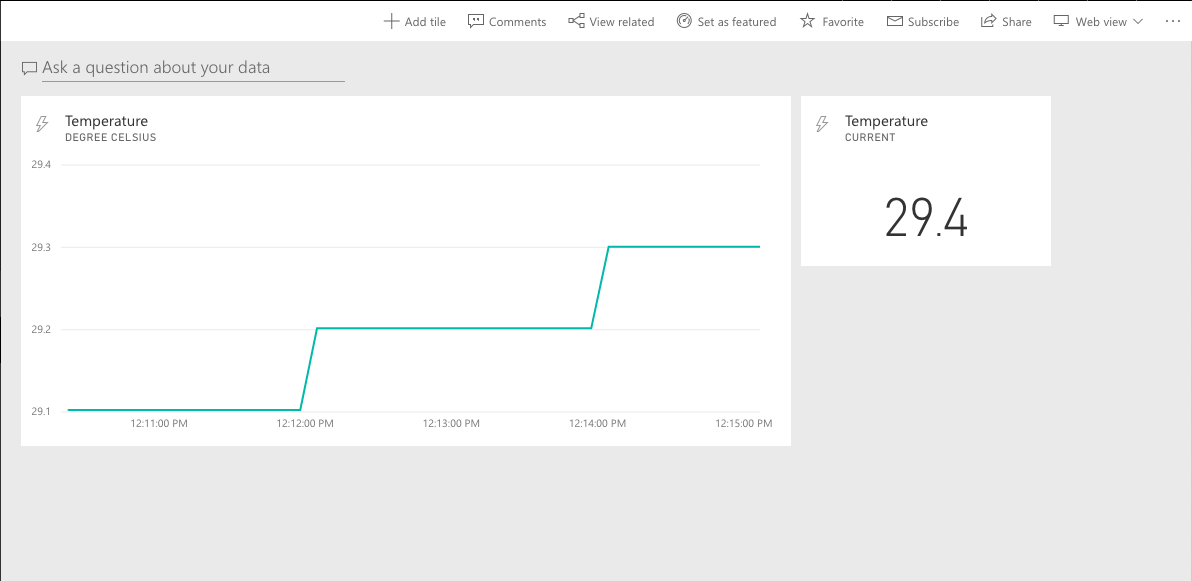
Congratulations, you have the first live dashboard of your IoT data! You can now play around with some other tiles if you want. I personally added a simple Card to display the current temperature as well. Here is my final dashboard:
I hope this post gave you a better idea of how the different pieces fit together. If you have any problems or feedback feel free to reach out! We will release a similar post for the other IoT platforms in the following weeks so stay tuned.
 (3 votes, average: 5.00 out of 5)